Conversion Analysis: How to Find and Fix What’s Costing You Conversions
In 8 years of analytics work, here’s the #1 mistake I see: businesses track conversions but never actually analyze them. They’ll set up a GA4 goal, glance at the number, and move on. That’s not conversion analysis — that’s just counting.
Real conversion analysis is a systematic process. You map out how users move through your site, find where they drop off, figure out why, and fix it. It’s the difference between knowing your conversion rate is 2.3% and knowing why it’s 2.3% — and what to do about it.
In this guide, I’ll walk you through a practical framework for conversion analysis, show you how to set it up in GA4, compare the best tools, and give you benchmarks to measure against. No theory — just what works.
Contents
- 1 What Is Conversion Analysis (and Why Most Teams Get It Wrong)
- 2 The Conversion Analysis Framework — 5 Steps
- 3 How to Set Up Conversion Analysis in GA4
- 4 Funnel Analysis: Where Users Drop Off and Why
- 5 Conversion Analysis in Your Marketing Strategy
- 6 Best Conversion Analysis Tools Compared
- 7 Conversion Rate Benchmarks by Industry
- 8 Common Conversion Analysis Mistakes
- 9 FAQ
- 10 Start With One Funnel
What Is Conversion Analysis (and Why Most Teams Get It Wrong)
Conversion analysis is the process of tracking, measuring, and interpreting user actions on your website to understand what drives people to convert — and what stops them.
A conversion is any action you want users to take. That could be a purchase, a sign-up, a form submission, or even clicking a specific button. There are two types:
- Macro-conversions — your primary goals. A completed purchase, a subscription sign-up, a demo request.
- Micro-conversions — smaller steps that lead to macro-conversions. Adding an item to cart, watching a product video, downloading a PDF.
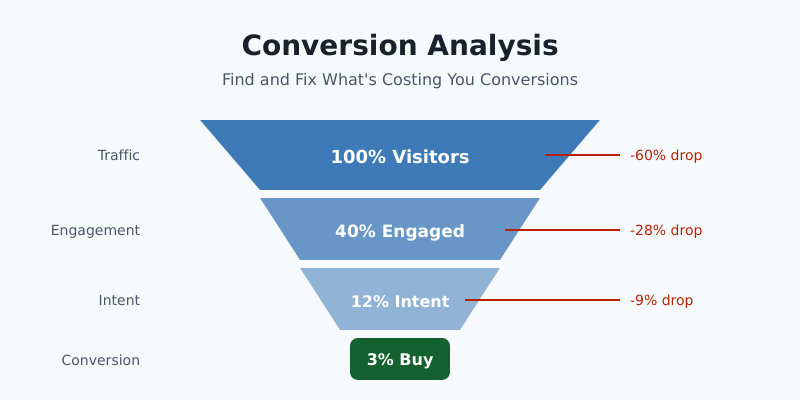
Here’s where most teams get it wrong: they only track macro-conversions. They know 3 out of 100 visitors buy something, but they have no idea what happened to the other 97. Conversion analysis in marketing solves this by examining the entire journey — not just the finish line.
If you’re only looking at your conversion rate, you’re only seeing the scoreboard. Conversion analysis shows you the game.
The Conversion Analysis Framework — 5 Steps
I’ve used this framework with e-commerce brands, SaaS companies, and lead-gen sites. It works regardless of your industry or tech stack. Here’s how to build a solid conversion strategy from the ground up.
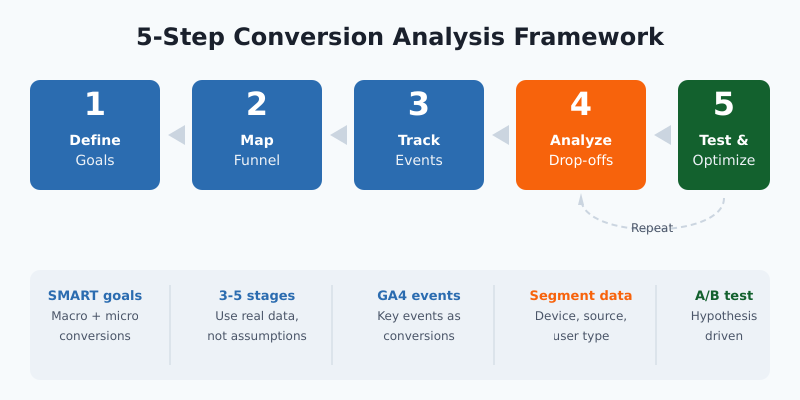
Step 1: Define Your Conversion Goals
Start with what matters. What’s the one action that directly ties to revenue? That’s your primary macro-conversion. Then identify 3-5 micro-conversions that lead up to it.
For an e-commerce store, it might look like this:
- Micro: Product page view → Add to cart → Begin checkout
- Macro: Purchase completed
Make your goals specific. “Increase conversions” isn’t a goal. “Increase checkout completion rate from 45% to 55% in Q2” is.
Step 2: Map Your Funnel Stages
Draw out the exact path users take from first touch to conversion. Don’t assume — use your actual data. Most funnels have 3-5 stages, and the shape of your funnel tells you where to focus.
Step 3: Set Up Tracking
You can’t analyze what you don’t measure. Set up event tracking for every funnel stage in GA4 (more on this in the next section). Tag key actions as conversions.
Step 4: Analyze Drop-offs and Patterns
This is where the real work happens. Look at each stage of your funnel and ask: what percentage of users move to the next step? Where’s the biggest drop? Does it vary by device, traffic source, or user type?
Step 5: Test and Optimize
Form a hypothesis based on your analysis, run an A/B test, and measure the result. Then repeat. Conversion analysis isn’t a one-time project — it’s an ongoing cycle.
How to Set Up Conversion Analysis in GA4
Google Analytics 4 gives you everything you need for website conversion analysis — if you set it up correctly. Here’s how.
Mark Key Events as Conversions
In GA4, go to Admin → Events. Find the events that represent your conversion goals and toggle “Mark as key event.” Common ones include:
purchase— for e-commerce transactionsgenerate_lead— for form submissionssign_up— for account creationbegin_checkout— for checkout starts
If the event doesn’t exist yet, create it. Go to Admin → Events → Create event and define the trigger conditions.
Build a Funnel Exploration
This is GA4’s most powerful report for conversion analysis. Go to Explore → Funnel exploration and set up your steps:
- Add your funnel stages as steps (e.g.,
page_view→add_to_cart→begin_checkout→purchase) - Set the funnel to “open” or “closed” depending on whether users must follow the exact sequence
- Add breakdowns: device category, session source/medium, or country
The breakdown dimension is key. A 60% drop-off at checkout might look normal overall — but when you segment by device, you might discover it’s 80% on mobile and only 30% on desktop. That’s a mobile UX problem, not a pricing problem.
What to Look For
Focus on three things in your funnel report:
- Biggest absolute drop-off — which step loses the most users?
- Unexpected drops by segment — any device, source, or audience that performs significantly worse?
- Time between steps — are users stalling at a specific point?
Funnel Analysis: Where Users Drop Off and Why
Numbers tell you where users drop off. Funnel analysis helps you understand why. Here’s how to investigate each stage.
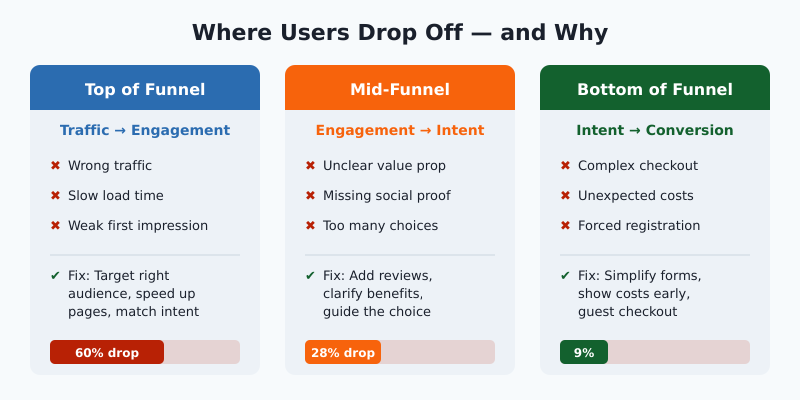
Top of Funnel: Traffic → Engagement
If visitors land on your site but don’t engage, the problem is usually one of three things:
- Wrong traffic — your ads or SEO attract people who aren’t your target audience
- Slow load time — pages taking more than 3 seconds lose over half their visitors
- Weak first impression — the page doesn’t match what the user expected
Mid-Funnel: Engagement → Intent
Users are browsing but not taking action. Common culprits:
- Unclear value proposition
- Missing social proof (reviews, testimonials)
- Too many choices without guidance
Bottom of Funnel: Intent → Conversion
These users were ready to convert but didn’t. This is where you lose the most revenue. Typical blockers:
- Complicated checkout or sign-up process
- Unexpected costs (shipping, taxes, fees)
- Required account creation
- Payment method limitations
Combine Quantitative + Qualitative
GA4 shows you the drop-off numbers. To understand the “why,” add qualitative tools:
- Heatmaps — see where users click (and where they don’t)
- Session recordings — watch real users navigate your funnel
- On-site surveys — ask exit-intent questions like “What stopped you from completing your purchase?”
The best conversion insights come from combining what users do (analytics) with what they say (surveys) and what you observe (recordings).
Conversion Analysis in Your Marketing Strategy
Conversion analysis isn’t just a website optimization exercise. When you integrate conversion analysis in your marketing strategy, it transforms how you allocate budget, plan campaigns, and measure success.
Channel-Level Analysis
Break down conversion rates by marketing channel. You might find that paid search converts at 4.2% while social media sits at 0.8%. That doesn’t automatically mean you should cut social — the assisted conversion data might tell a different story. But it gives you a starting point for optimization.
Content Performance
Which blog posts, landing pages, or resources lead to conversions? Use GA4’s path exploration to trace the journey from content consumption to conversion. Double down on content types that appear frequently in converting paths.
Campaign Optimization
Run conversion analysis after every campaign. Don’t just measure “did we hit our target.” Ask: where in the funnel did this campaign’s traffic behave differently? That insight improves your next campaign.
Budget Allocation
Use conversion data to shift budget toward channels, audiences, and creatives that actually drive results. I’ve seen teams cut cost-per-acquisition by 30-40% simply by reallocating based on funnel-level conversion data instead of last-click attribution.
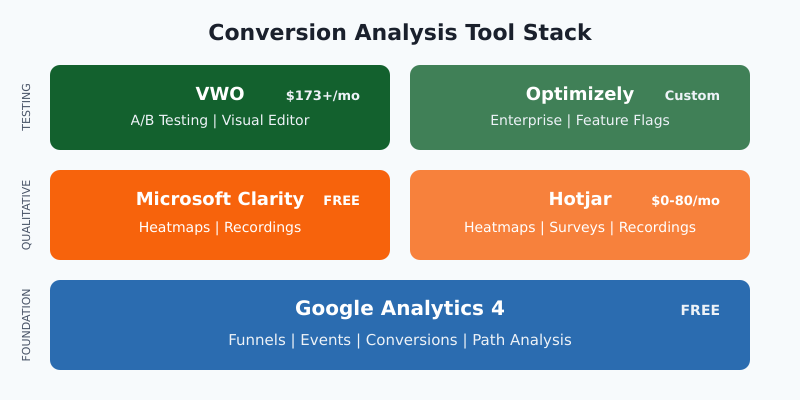
Best Conversion Analysis Tools Compared
You don’t need a dozen tools. Here are the conversion analysis tools that actually matter, organized by what they do best.
| Tool | Best For | Key Feature | Price |
|---|---|---|---|
| Google Analytics 4 | Foundational tracking | Funnel exploration, path analysis | Free |
| Hotjar | Qualitative insights | Heatmaps, recordings, surveys | Free–$80/mo |
| Microsoft Clarity | Free qualitative data | Session recordings, heatmaps | Free |
| Mixpanel | Product analytics | Advanced funnel analysis, retention | Free–$28/mo |
| VWO | A/B testing | Visual editor, multivariate tests | From $173/mo |
| Optimizely | Enterprise experimentation | Feature flags, server-side tests | Custom pricing |
My recommendation: Start with GA4 + Microsoft Clarity. It’s completely free and covers both quantitative funnel data and qualitative user behavior. Add Hotjar or VWO when you’re ready to run structured A/B tests.
Conversion Rate Benchmarks by Industry
Everyone asks “what’s a good conversion rate?” Here are current averages to use as a reference point for your conversion rate optimization efforts:
| Industry | Average Conversion Rate | Top Performers |
|---|---|---|
| E-commerce (overall) | 2.5–3.0% | 5%+ |
| SaaS (free trial) | 15–25% | 30%+ |
| B2B (lead gen) | 2–5% | 8%+ |
| Content / Media | 1–3% | 5%+ |
| Finance / Insurance | 5–7% | 10%+ |
But here’s the thing: industry averages are just context. Your real benchmark is your own baseline. If your checkout conversion is 40% today, aim for 45% next quarter. Compete with yourself — not with a number from a report you found online.
Common Conversion Analysis Mistakes
I’ve seen these derail conversion analysis efforts more times than I can count:
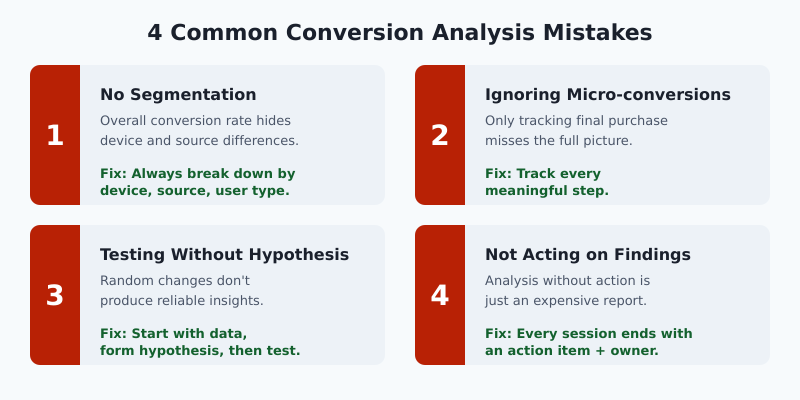
1. Analyzing without segmentation. Your overall conversion rate is an average of very different user groups. Always break data down by device, traffic source, and user type. The insight is in the segments.
2. Ignoring micro-conversions. If you only track purchases, you’re blind to everything that happens before the buy button. Track add-to-cart, sign-up starts, content downloads — every meaningful step.
3. Testing without a hypothesis. “Let’s try a green button” isn’t a test. “Mobile users abandon checkout because of form length — reducing fields will increase completion by 10%” is a test. Always start with data, form a hypothesis, then test.
4. Not acting on findings. The most common mistake. Teams run analysis, find issues, create a report… and nothing changes. Make sure every analysis session ends with a specific action item and an owner.
FAQ
How do you perform conversion analysis?
Start by defining your conversion goals and mapping your funnel stages. Set up event tracking in GA4, mark key events as conversions, and build a funnel exploration report. Analyze drop-offs at each stage, segment by device and traffic source, then test improvements with A/B experiments.
What is conversion analysis in marketing?
It’s the process of examining how marketing efforts translate into actual results — sign-ups, purchases, or leads. You analyze which channels, campaigns, and content drive conversions, where users drop off in the journey, and how to optimize each touchpoint for better ROI.
What tools do you need for conversion analysis?
At minimum, you need Google Analytics 4 for funnel tracking and a qualitative tool like Microsoft Clarity or Hotjar for heatmaps and session recordings. For A/B testing, add VWO or Optimizely. Most businesses can start effectively with just GA4 and Clarity — both are free.
How often should you run conversion analysis?
Run a full funnel review monthly. Monitor key conversion metrics weekly. After any major site change, campaign launch, or seasonal event, run an ad-hoc analysis within 2-3 weeks to capture enough data for meaningful insights.
What is a good conversion rate?
It depends on your industry and conversion type. E-commerce averages 2.5-3%, SaaS free trials 15-25%, and B2B lead gen 2-5%. But your best benchmark is your own historical data. Focus on consistent improvement over chasing an arbitrary “good” number.
Start With One Funnel
Conversion analysis can feel overwhelming if you try to analyze everything at once. Don’t. Pick your most important conversion — the one that directly drives revenue. Map that one funnel. Set up tracking for those specific steps. Analyze, find one problem, and fix it.
Then do it again.
That’s how you build a conversion analysis practice that actually moves the needle. Not with a massive audit, but with consistent, focused improvements — one funnel at a time.

About the Author
Tom Bradley
Marketing analyst with 8+ years in web analytics. I’ve completed 150+ GA4 implementations and helped 50+ brands turn data into growth strategies. Every guide on Viewing comes from real projects and real problems I’ve solved.